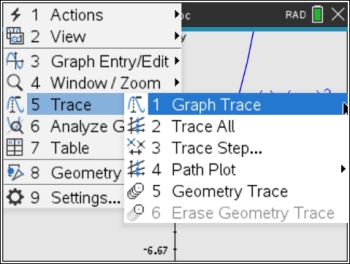
OPTION 1: Graph Trace
This is the primary tracing option.
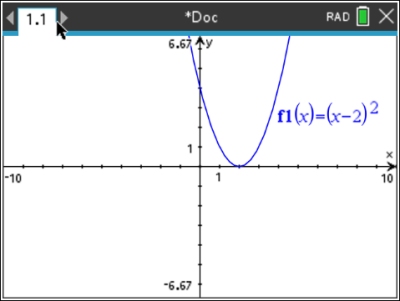
Enter the functions into f1(x).
Hit  to activate the graph. to activate the graph.
If you need to edit your f1(x) entry,
click on the f1 label in the graph area
to re-open f1(x).
|
|
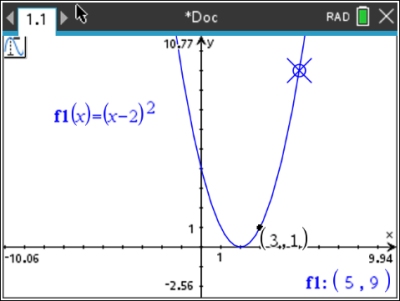
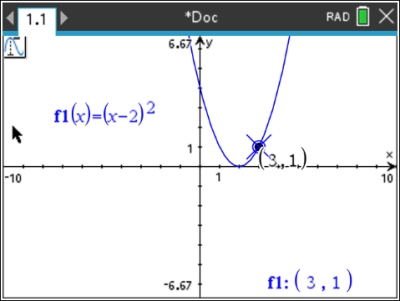
A "spider" will appear on the graph.
Use the Touchpad arrows to move right, , or left, , or left,  , along the function. , along the function.
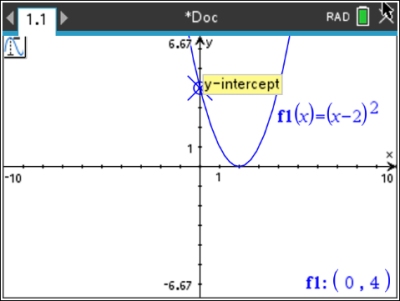
Values such as y-intercept, x-intercept, zero, maximum and minimum of the graph will automatically appear when encountered by the "spider".
Notice that the coordinates of the spider's location are displayed in the lower right corner.
|
|
To permanently label a point
with its coordinates on the graph,
press  or . or .
|
|
 To find a specific value while tracing: To find a specific value while tracing:
To "jump" to a certain x-coordinate on the screen,
start a "Trace" ( , 5, 1). , 5, 1).
Now, simply type the x-coordinate that you desire on the calculator pad. Let's hit the key for "5".
x = 5 will appear on the screen.
Now, hit
.
The "spider" will jump to the new point, and
the coordinates will appear in the lower right corner of the graph screen.
If you choose a value out of the current viewing window, the graph will adjust to include your new point. |
|
When using "Trace" with more than one function on the screen,
use the Touchpad arrows, up,  , and down, , and down,  , ,
to move between the graphs.
------------------------------------------------------------------------------------------------------------------
Option 2: Trace All
Compare Multiple Functions at the Same Time
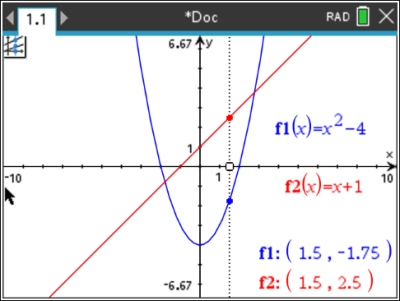
This option is used to compare multiple functions at the same time at the same x-value.
As the title implies, it interacts with "all" functions at the same time.
As you move across the graph, the x-value location will be highlighted (in color) along both graphs simultaneously.
A vertical black dotted line, along with an open circle on the x-axis, will guide you to the location of the points and their shared x-value. |
 |
------------------------------------------------------------------------------------------------------------------
Option 3: Trace Step
Set the Increments between Movements
This option controls how much the spider jumps horizontally as you press the arrow key to move to the left or right.
The "Automatic" step does not have a single fixed numerical value. Instead, it will automatically determine what it considers to be an appropriate step size based upon the current graphing window.
If you are looking for specific points, this may, or may not land on the point you want
(especially when dealing with decimal values). |
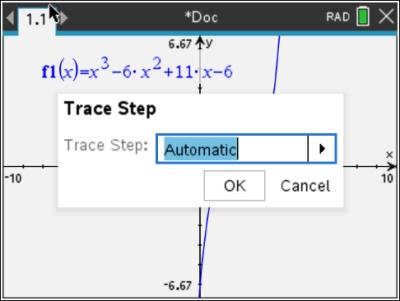 |
If you hit the right arrow, and choose "Enter Value", you can choose a step (increment) that will ensure that you land on the point, or points, you wish to investigate.
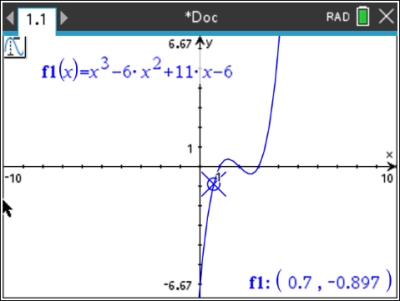
If you are working with values such as 3.5 and 4.2, choosing a step of 0.1 would be appropriate.
After setting the step option, you must return to Option 1 Trace Graph to see the new increment at work.
After setting the step to 0.1, the spider now moves in tenths across the graph at the right. |
 |
------------------------------------------------------------------------------------------------------------------
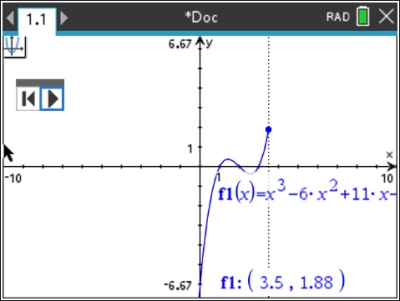
Option 4: Path Plot
Animate Plotting Functions, Parametric, Polar
This option will animate the plotting of functions, parametrics, and polar equations to show how the graphs are created. It shows the step-by-step process of creating the path of the equation across the coordinate grid.
It uses the play/pause button (that will appear on the grid) and the arrow keys to control what you are seeing. The vertical dotted line leads the movement.
Coordinate locations appear in the lower right. |
 |
------------------------------------------------------------------------------------------------------------------
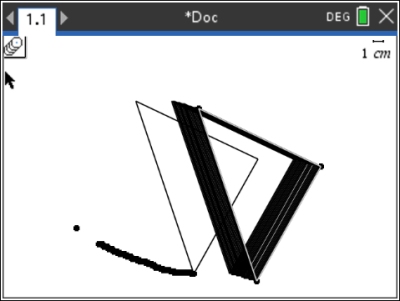
Option 5: Geometry Trace
Trail of a Moving Object
This option can be used under both "Graphs" and "Geometry" to leave a visual trail of a moving point, or of a moving geometric object.
The bottom point of the triangle started out at the single dot shown. The POINT was then traced to form the series of dots shown.
The TRIANGLE was traced to produce a series of triangles creating the darkened image. |
 |
|
|
|